Explainer
Size solar for your worst month, not the best: off-grid sizing rule
An off-grid system has to work in the month when the sun gives least and you need most. That month sets the array size.

On this page
Why the average misleads
A Penn State solar course says it directly: a stand-alone PV system should be able to supply its loads during any month of the year, and since solar energy generation varies by month, the month with the highest design ratio is the critical design month, taking into account the lowest insolation and highest load demand. Size for an average and you will be short in the worst month, exactly when a generator or a dark house is most expensive.
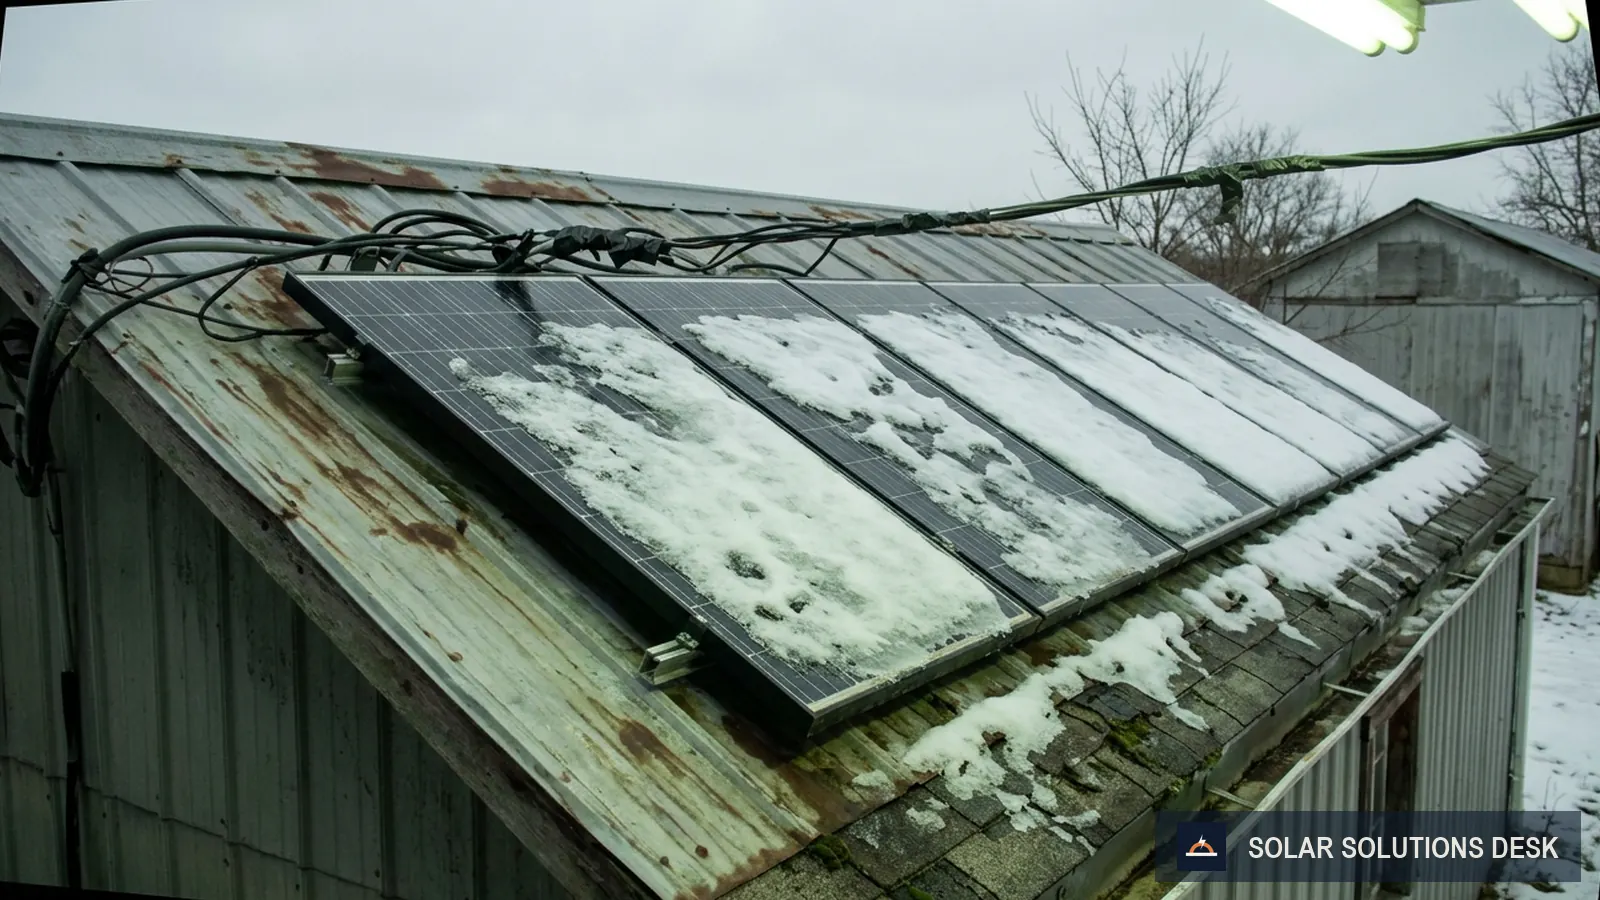
The swing is large. The U.S. Department of Energy notes that Denver, near 40 degrees latitude, receives nearly three times more solar energy in June than in December. At that location, a system that is comfortable in June has about a third of the energy to work with in December, before you count clouds or snow on the panels.
“Insolation” is the sunlight reaching a panel. It is often expressed as peak sun hours, defined by the University of Arizona Cooperative Extension as the number of hours the insolation is at 1,000 W/m². It is not the length of the day.
A four-step method
- Find your daily energy use in kWh, month by month. Your utility bill lists kWh per billing period; divide by the days. For a planned off-grid load, add up each device’s watts × hours. See watts versus watt-hours.
- Get your monthly solar output. PVWatts, from the National Laboratory of the Rockies (formerly NREL), estimates the energy production of grid-connected PV systems for a location, and reports monthly and annual totals. Enter your address and a 1 kW system to see the kWh that each kilowatt of panels produces in each month.
- Divide, month by month. For each month: daily load (kWh) ÷ daily output per kW (kWh) = array size needed (kW).
- Take the largest result. That is your critical design month, and the array size that covers it.
Worked example 1: winter decides (illustrative numbers)
Suppose your loads total 10 kWh per day all year. Suppose PVWatts shows 1 kW of panels producing 2.5 kWh per day in December and 5.5 kWh per day in June. These figures are made up to show the method; yours will differ.
| Month | Output per 1 kW | Array needed for 10 kWh/day |
|---|---|---|
| June | 5.5 kWh/day | 10 ÷ 5.5 ≈ 1.8 kW |
| December | 2.5 kWh/day | 10 ÷ 2.5 = 4.0 kW |
December decides. An array sized for June would be less than half the size you need in December.
Now the yearly-average trap, with the same made-up numbers. If the year averages 4.0 kWh per kW per day, an array sized on the average is 10 ÷ 4.0 = 2.5 kW. In December that array makes 2.5 × 2.5 = 6.25 kWh, which is 62.5% of the load (our calculation). The other 3.75 kWh a day has to come from a generator or from not using it.
Worked example 2: summer decides (illustrative numbers)
The critical month is the highest ratio, not automatically the darkest. Take a home where air conditioning lifts the July load. Again the output figures are invented.
| Month | Daily load | Output per 1 kW | Array needed |
|---|---|---|---|
| January | 18 kWh | 3.0 kWh/day | 18 ÷ 3.0 = 6.0 kW |
| April | 14 kWh | 5.0 kWh/day | 14 ÷ 5.0 = 2.8 kW |
| July | 42 kWh | 6.0 kWh/day | 42 ÷ 6.0 = 7.0 kW |
July decides at 7.0 kW even though it is the sunniest month. A winter-only check would have stopped at 6.0 kW. For scale, EIA reports that the average U.S. residential customer bought 10,791 kWh in 2022, about 899 kWh a month, which is roughly 29.6 kWh a day by our arithmetic (10,791 ÷ 365). An all-electric or air-conditioned house can sit well above that, and an off-grid cabin well below.
From array to battery
The same course gives the battery side. The bank’s output capacity is the critical-month daily energy times the days of autonomy, divided by the DC system voltage. The rated capacity then divides that by the allowable depth of discharge and a temperature and discharge-rate derating factor. The course notes allowable depth of discharge ranges from 20% to 80% depending on battery type.
The array formula in the course also divides by battery efficiency. If 90% of what goes into the battery comes back out (an assumption), the 4.0 kW from example 1 becomes 4.0 ÷ 0.9 ≈ 4.4 kW. For the real figure, look at the inverter sheet: EG4 lists a maximum battery-to-load efficiency of 90.2% for the 12000XP, and 93% battery discharging for the 6000XP. Those are best-case maxima. For the full battery method, use how much battery do you need.
Common mistakes
- Sizing from annual production. Dividing a year’s kWh by 365 gives a number that is wrong in every month below the average.
- Trusting one month of PVWatts as exact. The Version 5 manual says estimated monthly totals can be off by as much as ±30%, and a specific month can differ from the long-term average by up to ±40%. If December comes in 30% low, the 2.5 kWh/day in example 1 becomes 1.75, and the array for 10 kWh/day grows from 4.0 kW to about 5.7 kW (our arithmetic).
- Ignoring idle draw. An inverter consumes power just by being on. The 6000XP sheet lists about 50 W on battery, and the 12000XP sheet lists under 70 W. Over 24 hours, 50 W is 1.2 kWh, which is 12% on top of a 10 kWh load (our calculation).
- Leaving snow and shade at the defaults. The Version 5 manual’s default loss table shows 0% for snow and 3% for shading. The current Version 8 adds a monthly irradiance-loss input that can represent soiling or snow. If your worst month is snowy, use it.
- Using a tilt chosen for the annual total. The Penn State course advises choosing array orientation to match the critical design month. PVWatts takes tilt as an input, so run your critical month at more than one tilt.
- Treating watts and watt-hours as one number. The array and battery set energy; the inverter sets power. Size them separately.
Decision rules
- Compute the ratio for all twelve months. Do not assume winter.
- If the largest array is more than you can afford or fit, shrink the load before shrinking the safety margin. Cutting a winter-only load is cheaper than adding panels.
- If you accept a few bad days a year, say so on purpose. Penn State frames this as system availability, where 95% availability means the system cannot meet the load for 5% of the time. A generator covers that gap, so check the inverter has a generator input. The 6000XP sheet lists an AC bypass for grid or generator input, rated 50 A.
- If the critical month is a one-off, such as a rented cabin used only in July, size for the months you will actually be there.
- Re-run PVWatts with the loss fields set for your site before you buy anything.

Before you buy panels
- Write down the critical-month load, not the average. If you have no bills yet (a new cabin, say), list every device with its watts and daily hours for the busiest season, then add a margin for things you forgot.
- Run PVWatts for the exact address, at two or three tilts. Note the lowest month and the month your load peaks. They are often different months.
- Add the inverter’s idle draw and battery losses to the load before dividing, using the numbers on the maker’s sheet for your model and revision.
- Check roof or ground space against the answer. A 7 kW answer is useless if the site fits 4 kW. Better to learn that before ordering.
- Ask what the plan is for the bad weeks. Cloudy stretches in the critical month are normal. Write down the backup: generator, load shedding, or a bigger battery.
Next
An array only helps if the battery and inverter match it. Continue with how much battery do you need, or step back to off-grid, hybrid or grid-tied. To see how long a given battery runs your house, try the runtime tool. Wiring and battery work needs a licensed electrician and local code.
Questions people ask
What are peak sun hours?
The number of hours at which the sunlight intensity would be 1,000 watts per square meter. It is a way of expressing a day's total sunshine as full-strength hours, not the number of hours of daylight.
Should I size off-grid solar for summer or winter?
For the month that needs the biggest array: the one where your load, divided by the solar output per kilowatt of panels, is highest. In many places that is a low-sun month, but a home with heavy summer air conditioning can have a summer critical month. Calculate every month and take the largest.
Why not size from the yearly average?
Because the average hides the bad months. An array that exactly covers your load on a yearly average produces less than your load in every month below that average, and a stand-alone system has no grid to make up the difference.
Does PVWatts include losses?
Yes. PVWatts applies a total system loss figure. Its Version 5 manual gives a default of 14 percent (the current Version 8 tool may differ, so read the loss fields when you run it), so its output is already lower than the panels' rated power would suggest. Battery and inverter idle losses come on top.
Can I use PVWatts for an off-grid system?
Use it for the production side only. NLR describes PVWatts as an estimator for grid-connected systems. It gives monthly kWh per kilowatt of panels, which is the number the sizing method needs, but it does not model your battery or your loads.
How many days of battery should I add on top?
That is a separate choice. Penn State's course uses system availability: for example, 95 percent availability with about 5.0 peak sun hours needs about 3 days of autonomy, and 99 percent at about 4.0 needs about 10. Treat those as the course's examples, not a rule for your site.
Read next

Watts vs watt-hours: power and energy, explained
A watt measures power at a moment; a watt-hour measures energy over time. A 1,000 W heater running for one hour uses 1 kWh.
What is a LiFePO4 battery? LFP vs lead-acid explained
LiFePO4 (LFP) is a lithium-ion chemistry with an iron phosphate cathode. It trades energy density for long cycle life and thermal…

Amp-hours vs watt-hours: how to convert and compare batteries
Watt-hours equal amp-hours times volts. A 100 Ah battery holds 1,200 Wh at 12 V but 5,120 Wh at 51.2 V, so Ah alone misleads.